
PaxDex Research Q2 Subscriber Letter
PaxDex Q2 2024 Returns, Performance Review, and Portfolio Outlook.

Hi all! Below is a Docsend link to the quarterly subscriber in PDF format, but I've also written it out here for those who would like to read it on Substack.
PaxDex Research Q2 2024 Subscriber Letter
Dear Subscribers:
For U.S. equity investors, in the second quarter of 2024, the S&P 500 rose at an above-average return, with U.S. equity markets returning 3.92% in Q2. This was amid falling hopes for rate cuts as stubborn inflation continued, with core PCE accelerating on a 6-month annualized basis. However, through the quarter and towards the end, we started to see hints of weakness, specifically in the housing market.
Returns:
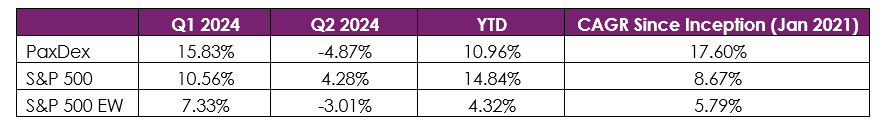
PaxDex generated a -4.87% return in the second quarter, underperforming the S&P 500 return of 4.28% and S&P 500 Equal Weight of -3.01%, per FactSet. PaxDex runs at 70 – 85% SMID cap exposure on average, so PaxDex’s correct benchmark leans towards the S&P EW; however, we compare it to the S&P 500, knowing this is what most investors compare to daily and over long-time periods. During Q2, PaxDex underperformed the broader market mainly due to being late to switch short on housing-related stocks like BLDR. YTD performance now stands at 10.96%, and CAGR performance since inception (Jan 2021) is 17.60%, both higher than the S&P 500. Additionally, since the start of 2023, PaxDex exposure to mega-cap ($500bn+ mkt cap) stocks has never exceeded 15%. Moreover, since the beginning of 2023, PaxDex has had 0% exposure to semiconductors. Having little expertise in semis has been a headwind for the portfolio’s performance since 2023, and in light of this, PaxDex has outperformed zooming out. Once the tide eventually flips to investors being bearish on semis, it will allow for material outperformance as semis now comprise ~20% exposure in the S&P 500.
Performance Review and Portfolio Outlook
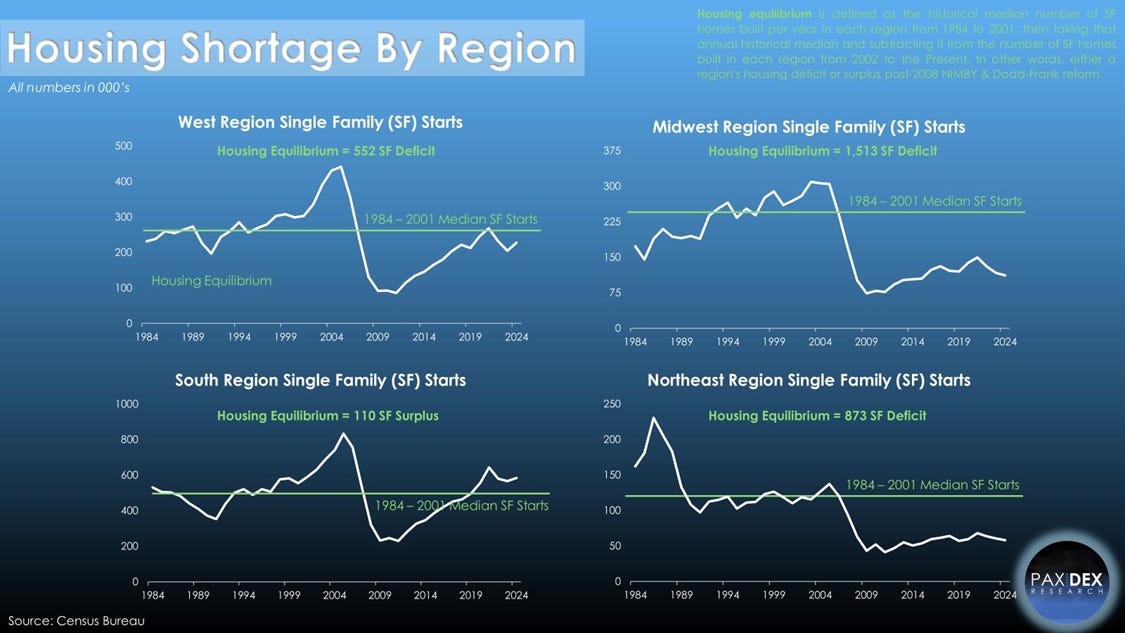
As mentioned earlier, PaxDex’s housing-related bets performed the worst, all down at least double-digit percentage points, with BLDR being the brunt of it down ~20% before being sold and attributed ~220bps decline to this quarter’s performance. Single-family starts peaked in February at 1.134 million units SAAR, and May has declined each month, with May SF starting at 0.982 million. As I discussed in June in my “Housing Stocks Tailwinds Ending?” post, high interest rates are finally hitting private builders with incentives up significantly YoY in the South, providing a compressing margin setup for H2 2024 and H1 2025. Additionally, we have finally started to see the housing shortage thesis for years end in the South/Sunbelt as states like Texas, Florida, Tennessee, Arizona, and more are all about to or already dozens of percentages in inventory above 2019 levels. Higher inventory will compress builders' margins and could provide a setup for home prices to stall or decline in the South. Below is a chart depicting the housing shortage by region in our country; note that the shortage does not exist outside of the South as all other regions are still big believers in NIMBY, making it extremely difficult to increase housing supply but because the South comprises ~55% of SF housing starts it matters significantly for all public building product and homebuilder stocks.
Two other trades I continue to own, and think will appreciate long-term but underperformed in the quarter were RRR and NICE, attributing a ~425bps decline to this quarter’s performance. NICE, making up ~325bps of that decline, fell from ~$270/share in April to below $160/share in the quarter, driven by investors' fears of AI, Microsoft competition, and the CEO stepping down. I believe all are overblown, and when it comes to AI, I think it will be a catalyst that will attribute significant growth to the business in the long term.
Multi-Manager Effect on Earnings Announcements
The big four, not accounting, multi-manager (MM) hedge funds (P72, MLP, BAM, and Citadel) have had record performance and growth in assets under management over the past several years. Their impact on our market has become increasingly important in understanding price action in the short term. The flow of capital has changed dramatically since 2008, and how the market prices a stock has changed considerably. While this isn’t any new news for active managers, I think it’d be beneficial for retail investors to understand this dynamic so you're not shocked when your stock slightly beats earnings but falls 20%.
How do MM funds impact short-term price action? Put simply, they increase reactionary volatility, e.g. a company missing an earnings expectation or vice versa beating an earnings expectation. MM funds trade books with very high leverage, and it isn’t abnormal for a pod to have a max drawdown threshold of 2% before being blown up. The high amount of leverage, low drawdown threshold, market neutrality, and, for some, factor neutrality means that for an MM to make its profits, it tends to be the short-term catalyst, which consists mostly of earnings announcements. MM analysts and PMs (Portfolio Managers) will spend a significant amount of time trying to understand the market expectations, which are different from estimates most may think of; that is, sell-side, the expectations of the market are the buy-side as the market is the one pricing stocks, therefore, buying and selling, hence buy-side.
Buy-side expectations are usually far from sell-side, so when a stock maybe beats EPS and revenue on sell-side estimates, that is not buy-side expectations, so you could still have a stock selloff significantly. The way an MM PM trades a book is very short-term oriented, as active exposure to the market without clear-cut catalysts generates higher risk to the book from unpredictable things, possibly CPI, PCE, FOMC meetings, etc… All these events for an MM increase unpredictable risk. What this means is you have high de-grossing and grossing-up periods in the market (gross is total capital, incl. leverage). Because MM’s number one catalyst to trade is earnings expectations, you tend to have extreme de-grossing and re-grossing moments when an earnings report is released, and this is why today you see massive earnings reactions to the upside or downside mostly not based on sell-side expectations, as sell-side expectations are naturally more long-term oriented the opposite of an MM PM.
What does this mean for long-term investors? Little if you hold true to being a long-term investor and know what business you are buying. In fact, the MM effect on markets today makes it more inefficient than ever since the GFC. This allows long-term investors with the right theses, also harder than ever, to have massive outperformance over 5 – 10-year periods. The MM effect on markets, I argue, forces long-term investors to understand the businesses they own more than ever; rather, they say, “But it's down 50%, and it’s a compounder stock.” That will lead to underperformance. Main takeaways: know what you own in its industry, competitors, valuation, catalysts near-term and long-term, estimates from both you and others, and constantly update your expectations and ideas on a rolling basis. If you do this successfully, your forward returns will look and feel very good.
As always, feel free to reach out to paxdexresearch@gmail.com with any questions.
Best Regards,
PaxDex Research